How do you monitor and troubleshoot applications on Azure?
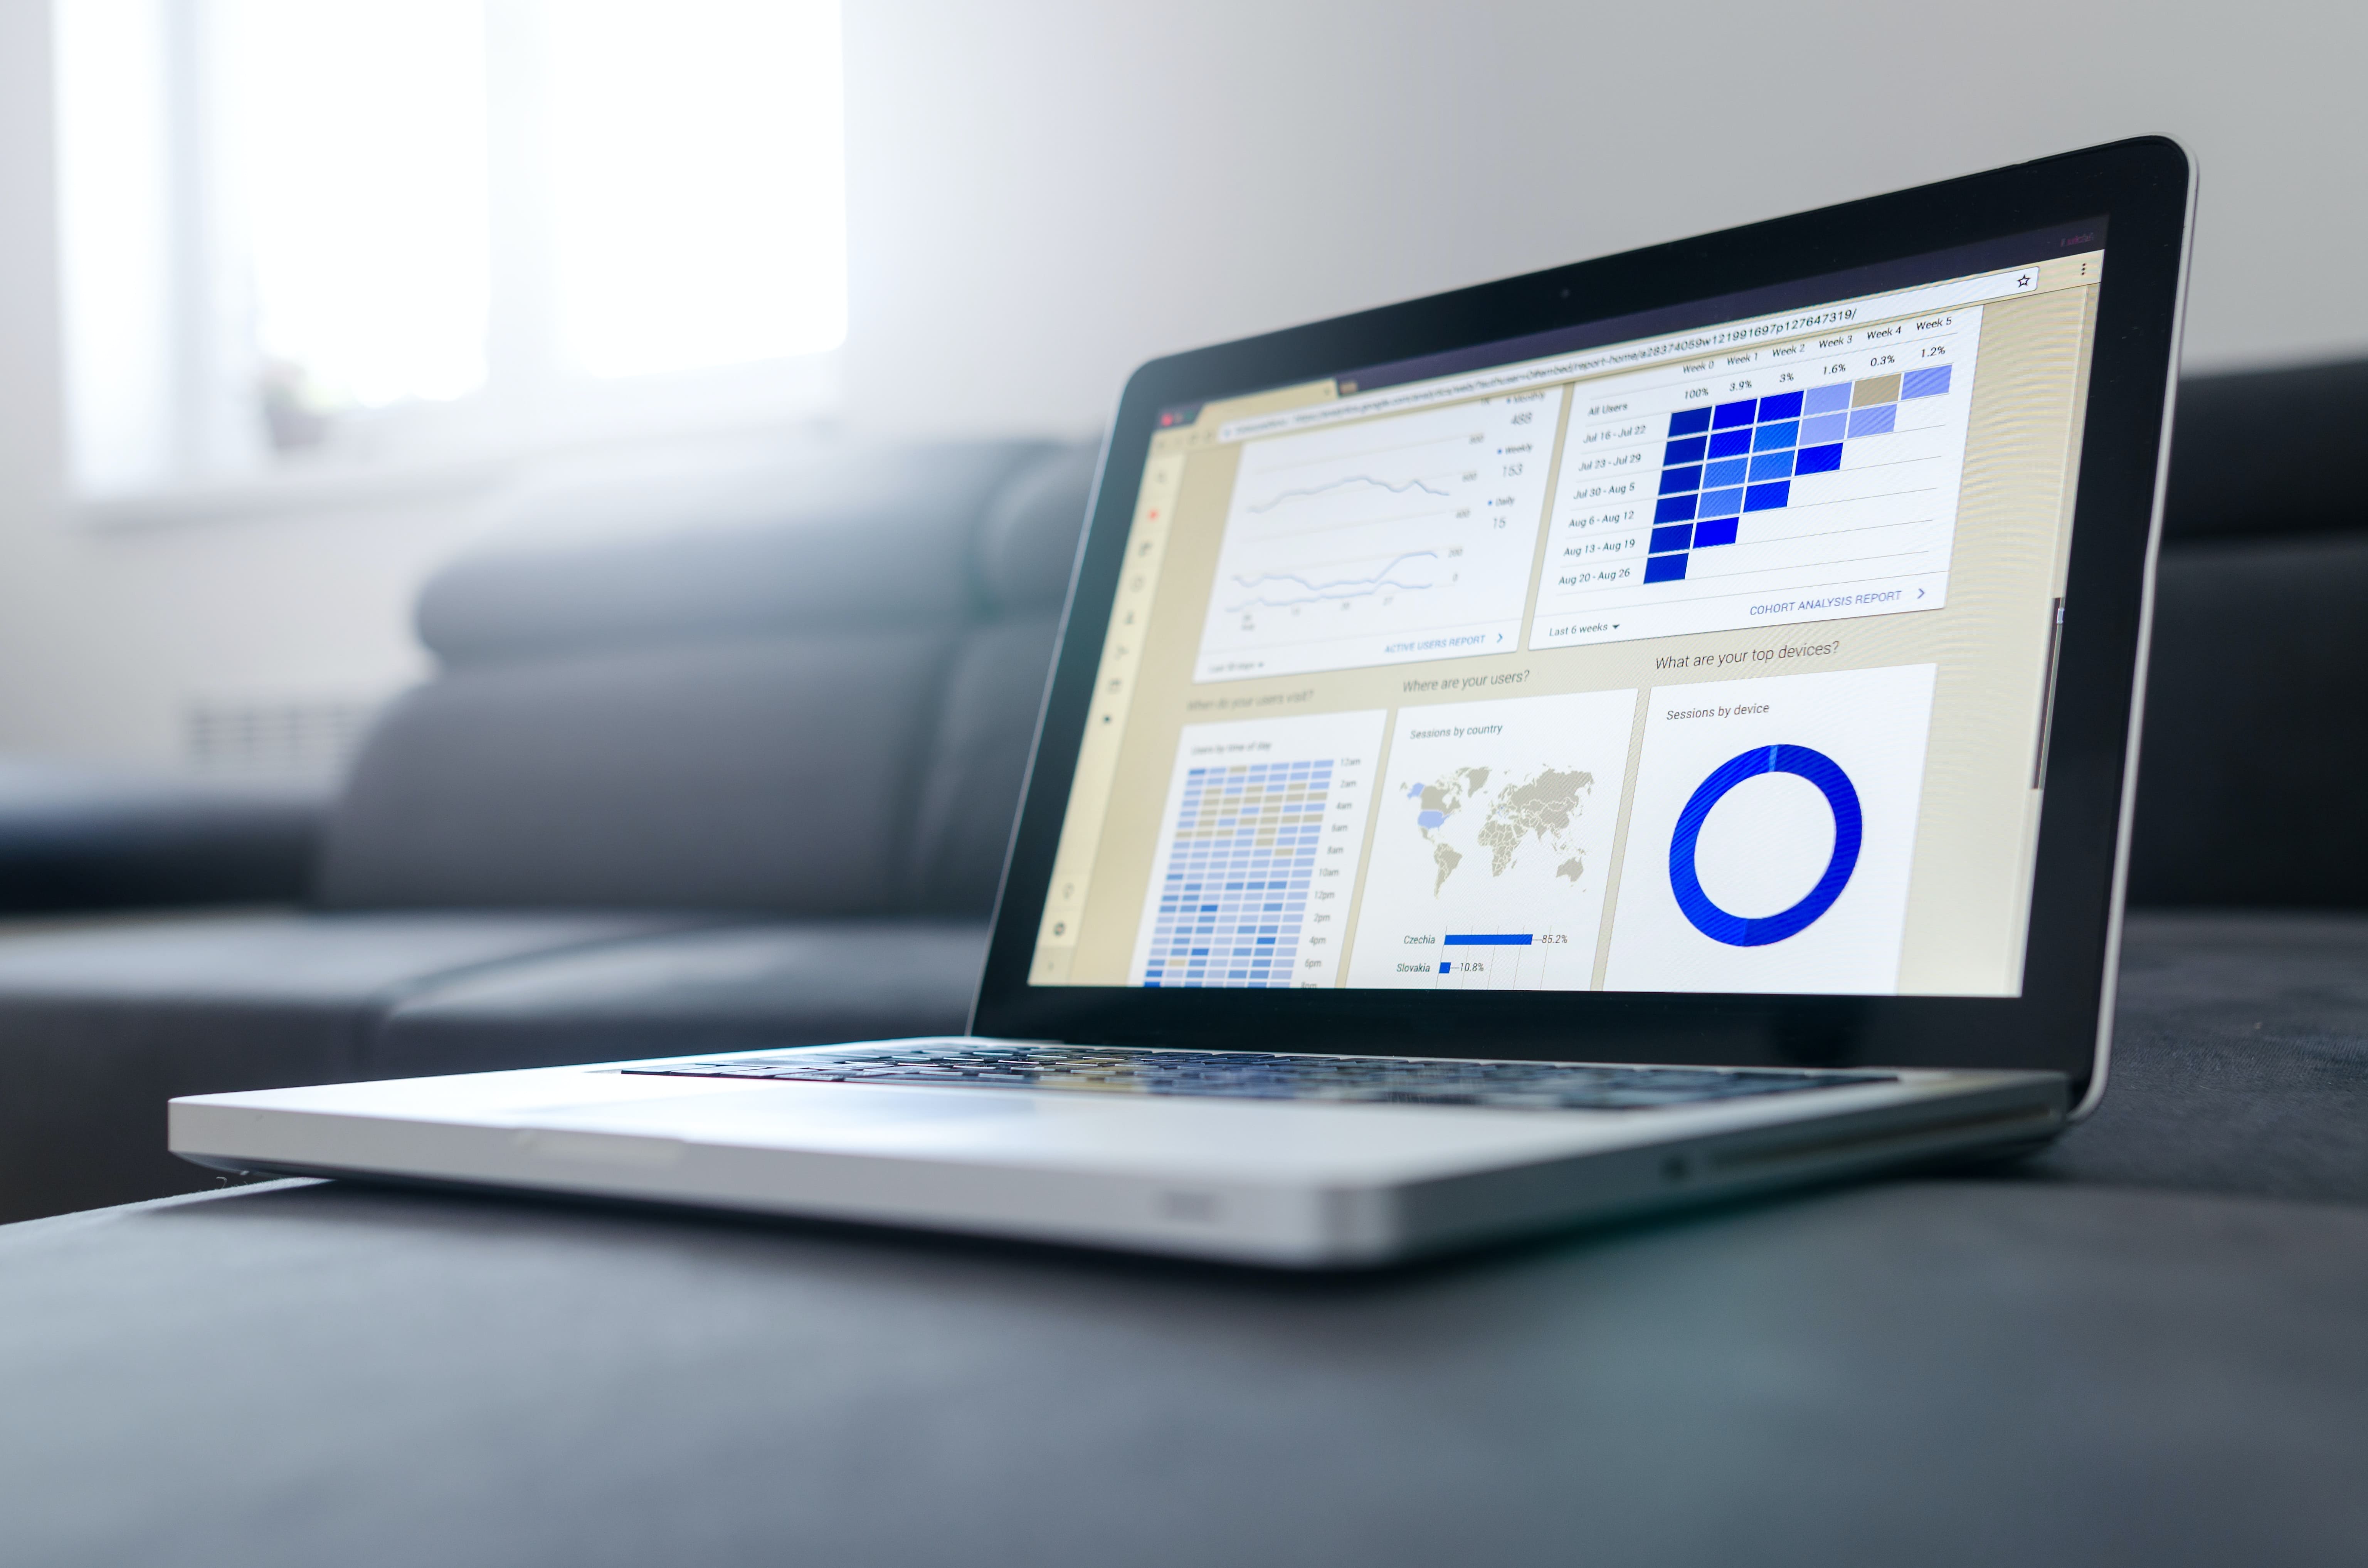
Azure Monitor is the umbrella, collecting two kinds of telemetry: metrics (numeric, time-series, cheap, near real-time) and logs (structured records in a Log Analytics workspace, queried with KQL).
The components:
- Application Insights — application-level telemetry: requests, dependencies, exceptions, traces, and custom events. The end-to-end transaction view is what lets you see which downstream call made a request slow, and the application map shows the dependency topology.
- Log Analytics — the query engine. KQL across platform logs, application logs, and metrics together.
- Alerts — on metric thresholds, log query results, or activity log events, routed through action groups to email, SMS, webhooks, or a paging tool.
- Workbooks and dashboards for visualisation.
- Service Health — platform-side incidents affecting your resources. Always check this first.
Practices that matter: enable diagnostic settings on every resource so logs actually go somewhere; use a correlation id across services so one request is traceable end to end; log structured data rather than formatted strings; and set retention deliberately, because Log Analytics ingestion is a common surprise on the bill.
Note: Alert on symptoms users feel — error rate, latency, availability — rather than on causes like CPU. Alerting on CPU produces noise; alerting on failed requests produces action.


 Log in with Google
 Log in with LinkedIn







.jpg)

.jpg)